
2026 Failure Ranking of Eight PV Module BOM Materials: What Is Holding Reliability Back?
Key points
Degradation is improving, but failures are rising: in the 2026 Kiwa PVEL Scorecard, 87% of manufacturers and 61% of BOMs failed at least once, and more than 70% of failures were packaging and structural problems such as breakage and delamination. Ranked by frequency and severity together, glass, encapsulant and the junction box take the top three places.
Let us start with something that may disappoint: there is no public, authoritative "complaint-rate ranking" of the eight main BOM materials in 2026. Complaint data are what module makers and material suppliers least want to show anyone; most of it sits in quality departments' 8D reports and never appears in a public report.
But there is a solid public substitute: the 12th edition of the PV Module Reliability Scorecard released in May by the independent lab Kiwa PVEL, together with the failure analysis it added in September at EU PVSEC and in the trade press. It breaks down the past year's failures of modules submitted by major manufacturers worldwide by type and by test sequence.
This article uses those data as its backbone, adds public research from IEA PVPS, kWh Analytics, UNSW and others, ranks the eight main BOM materials by failure risk, and reviews each one.
All percentages below are failure shares in accelerated lab testing. They are not field failure rates, still less complaint rates. The ranking is our own assessment based on these data, not an official ranking by any organisation.
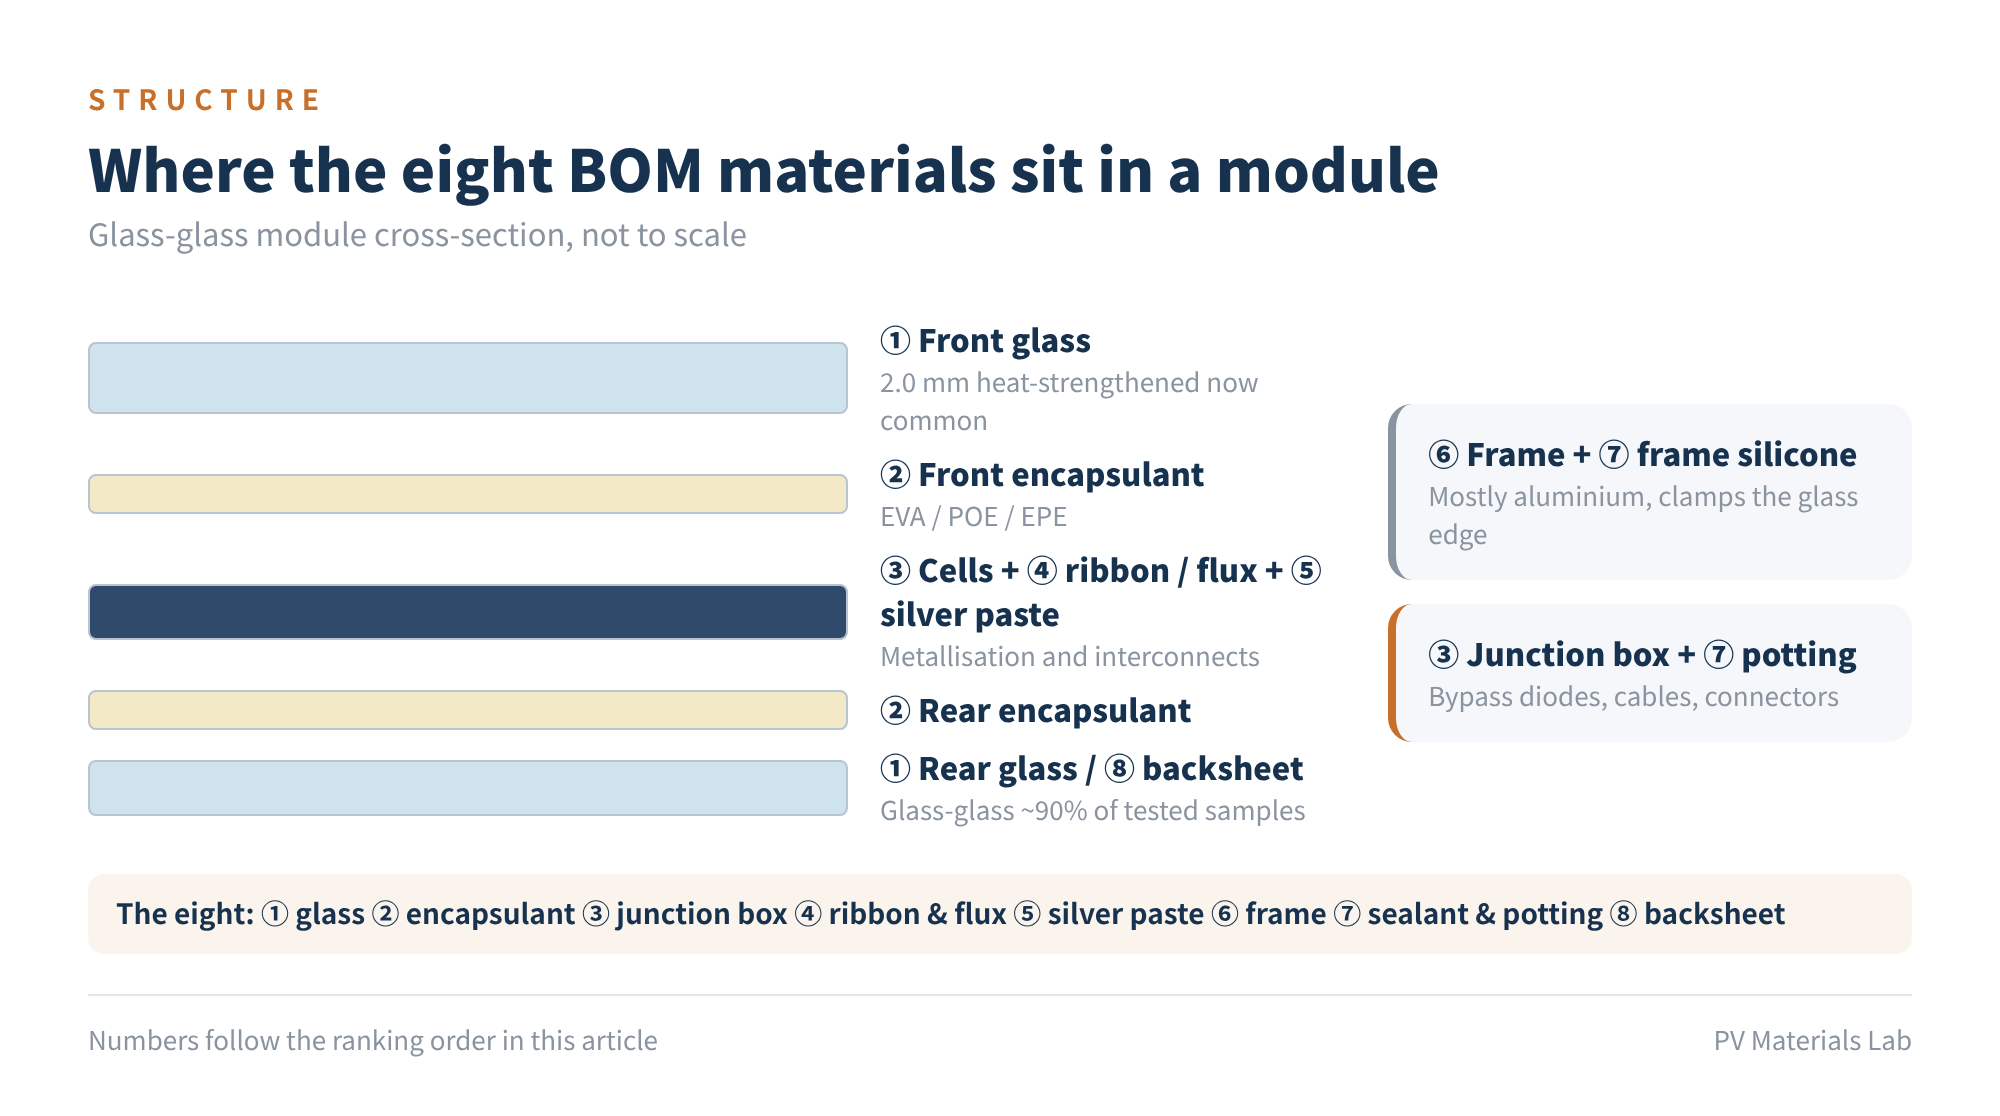
Figure 1 Where the eight BOM materials sit in a module
01The big picture: degradation improving, failures worsening
The two most striking numbers in the 2026 Scorecard: 87% of manufacturers and 61% of BOMs had at least one failure in testing, an all-time high. The previous edition recorded 83% and 59%; two years ago the figures were about two-thirds and 41%. On a BOM basis, this is the fourth record in a row.
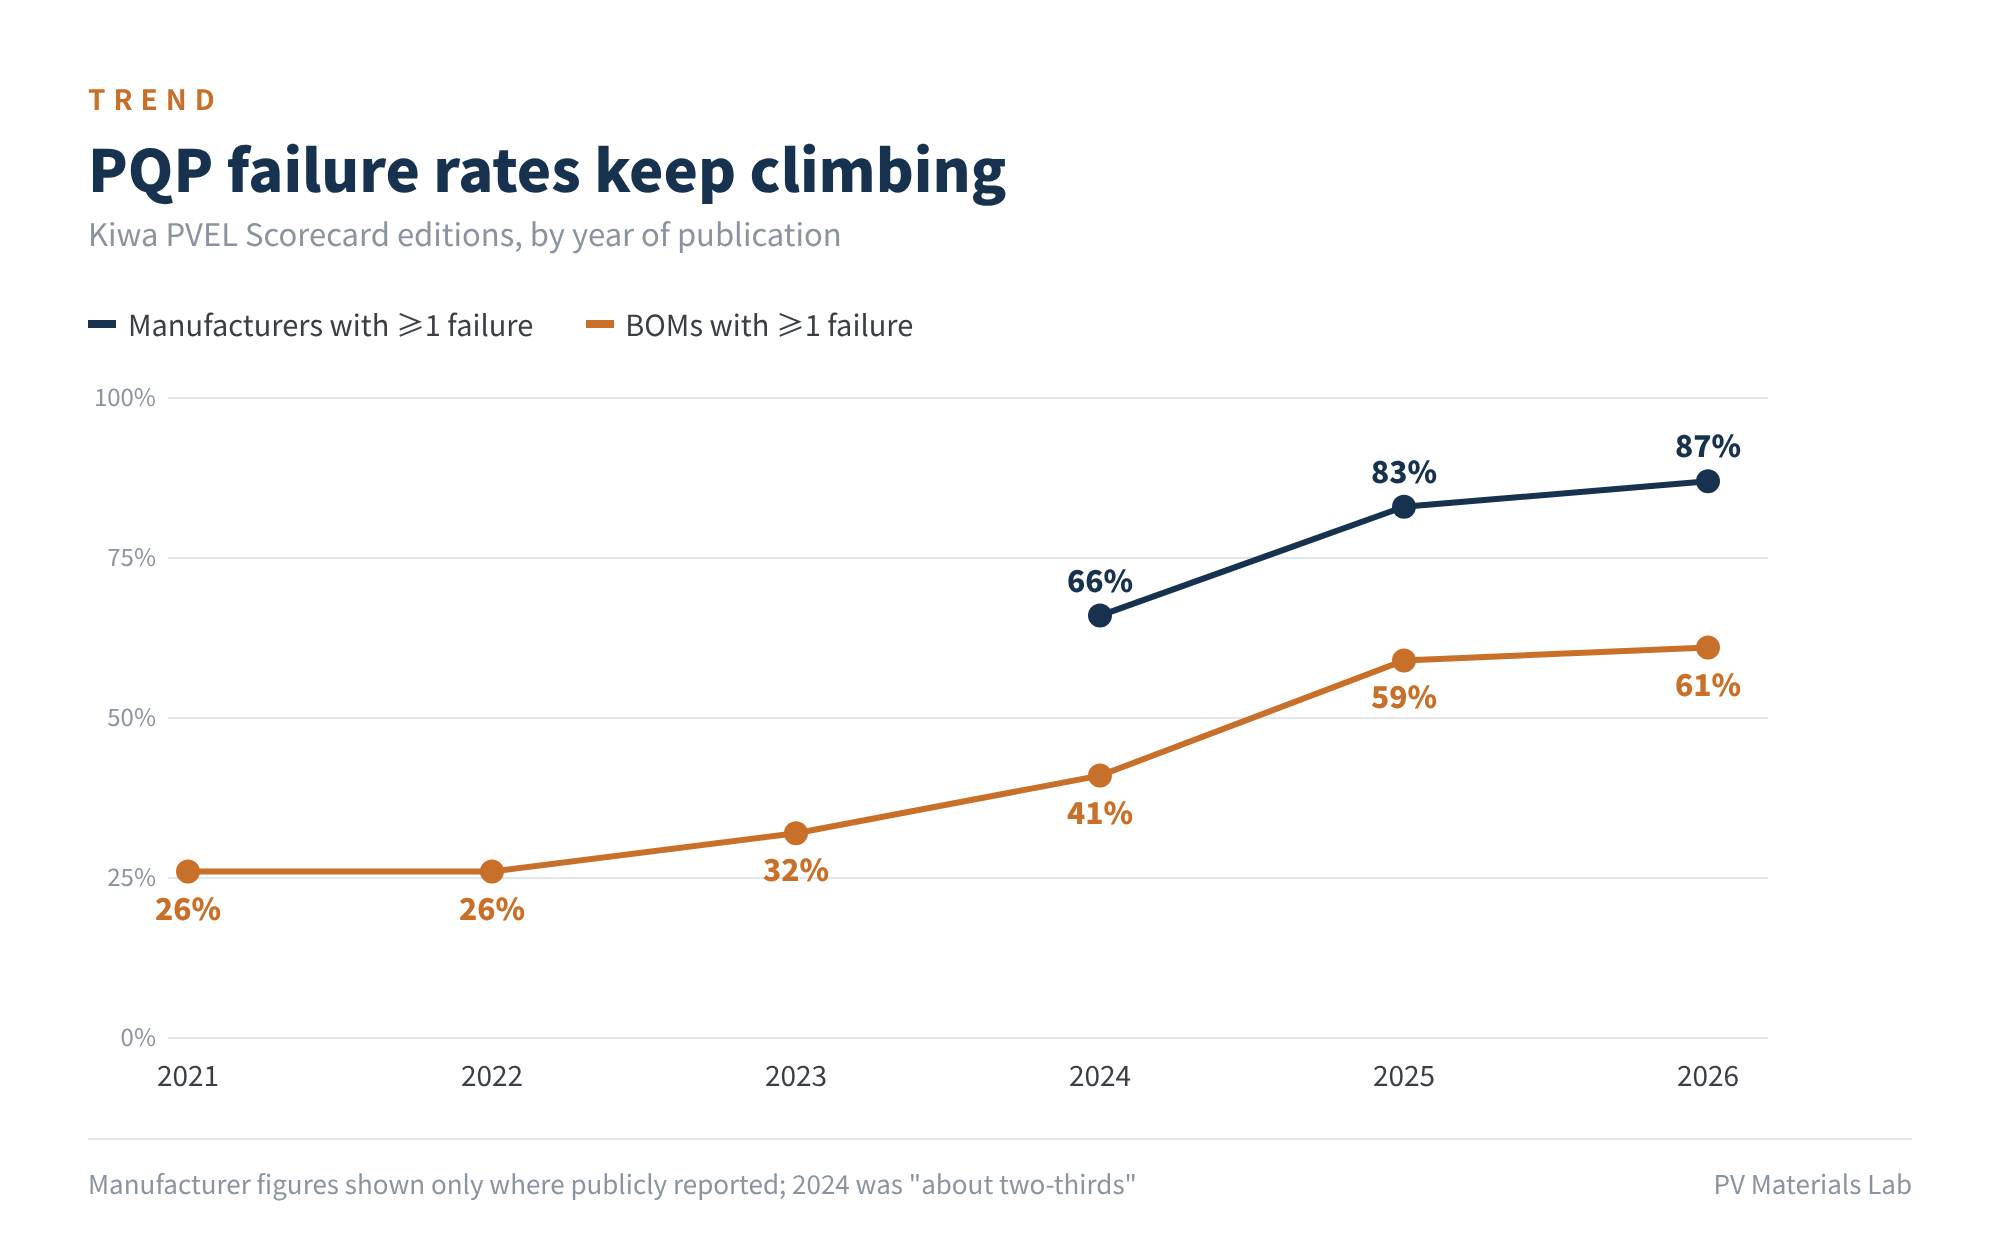
Figure 2 PQP failure rates keep climbing
Interestingly, the same report shows power degradation improving: power losses after thermal cycling (TC), damp heat (DH), PID and UVID all fell, and the median UVID loss dropped from 4.2% to 3.0%.
So where are the failures? The report gives a clear split: 73% of all failures were major defects found in visual inspection; of these, 50% were module breakage and 46% delamination.
The question has moved from "will the cells degrade?" to "will the packaging and structure hold up?". And packaging and structure are exactly where BOM materials live.
One more detail: for the first time, no BOM was a Top Performer in all eight tests.
02The ranking: eight BOM materials by failure risk
The ranking uses two dimensions: frequency (how often the failure shows up in public test data) and severity (whether safety is involved and whether it can be repaired). Frequency is backed by data; severity is our engineering judgement.
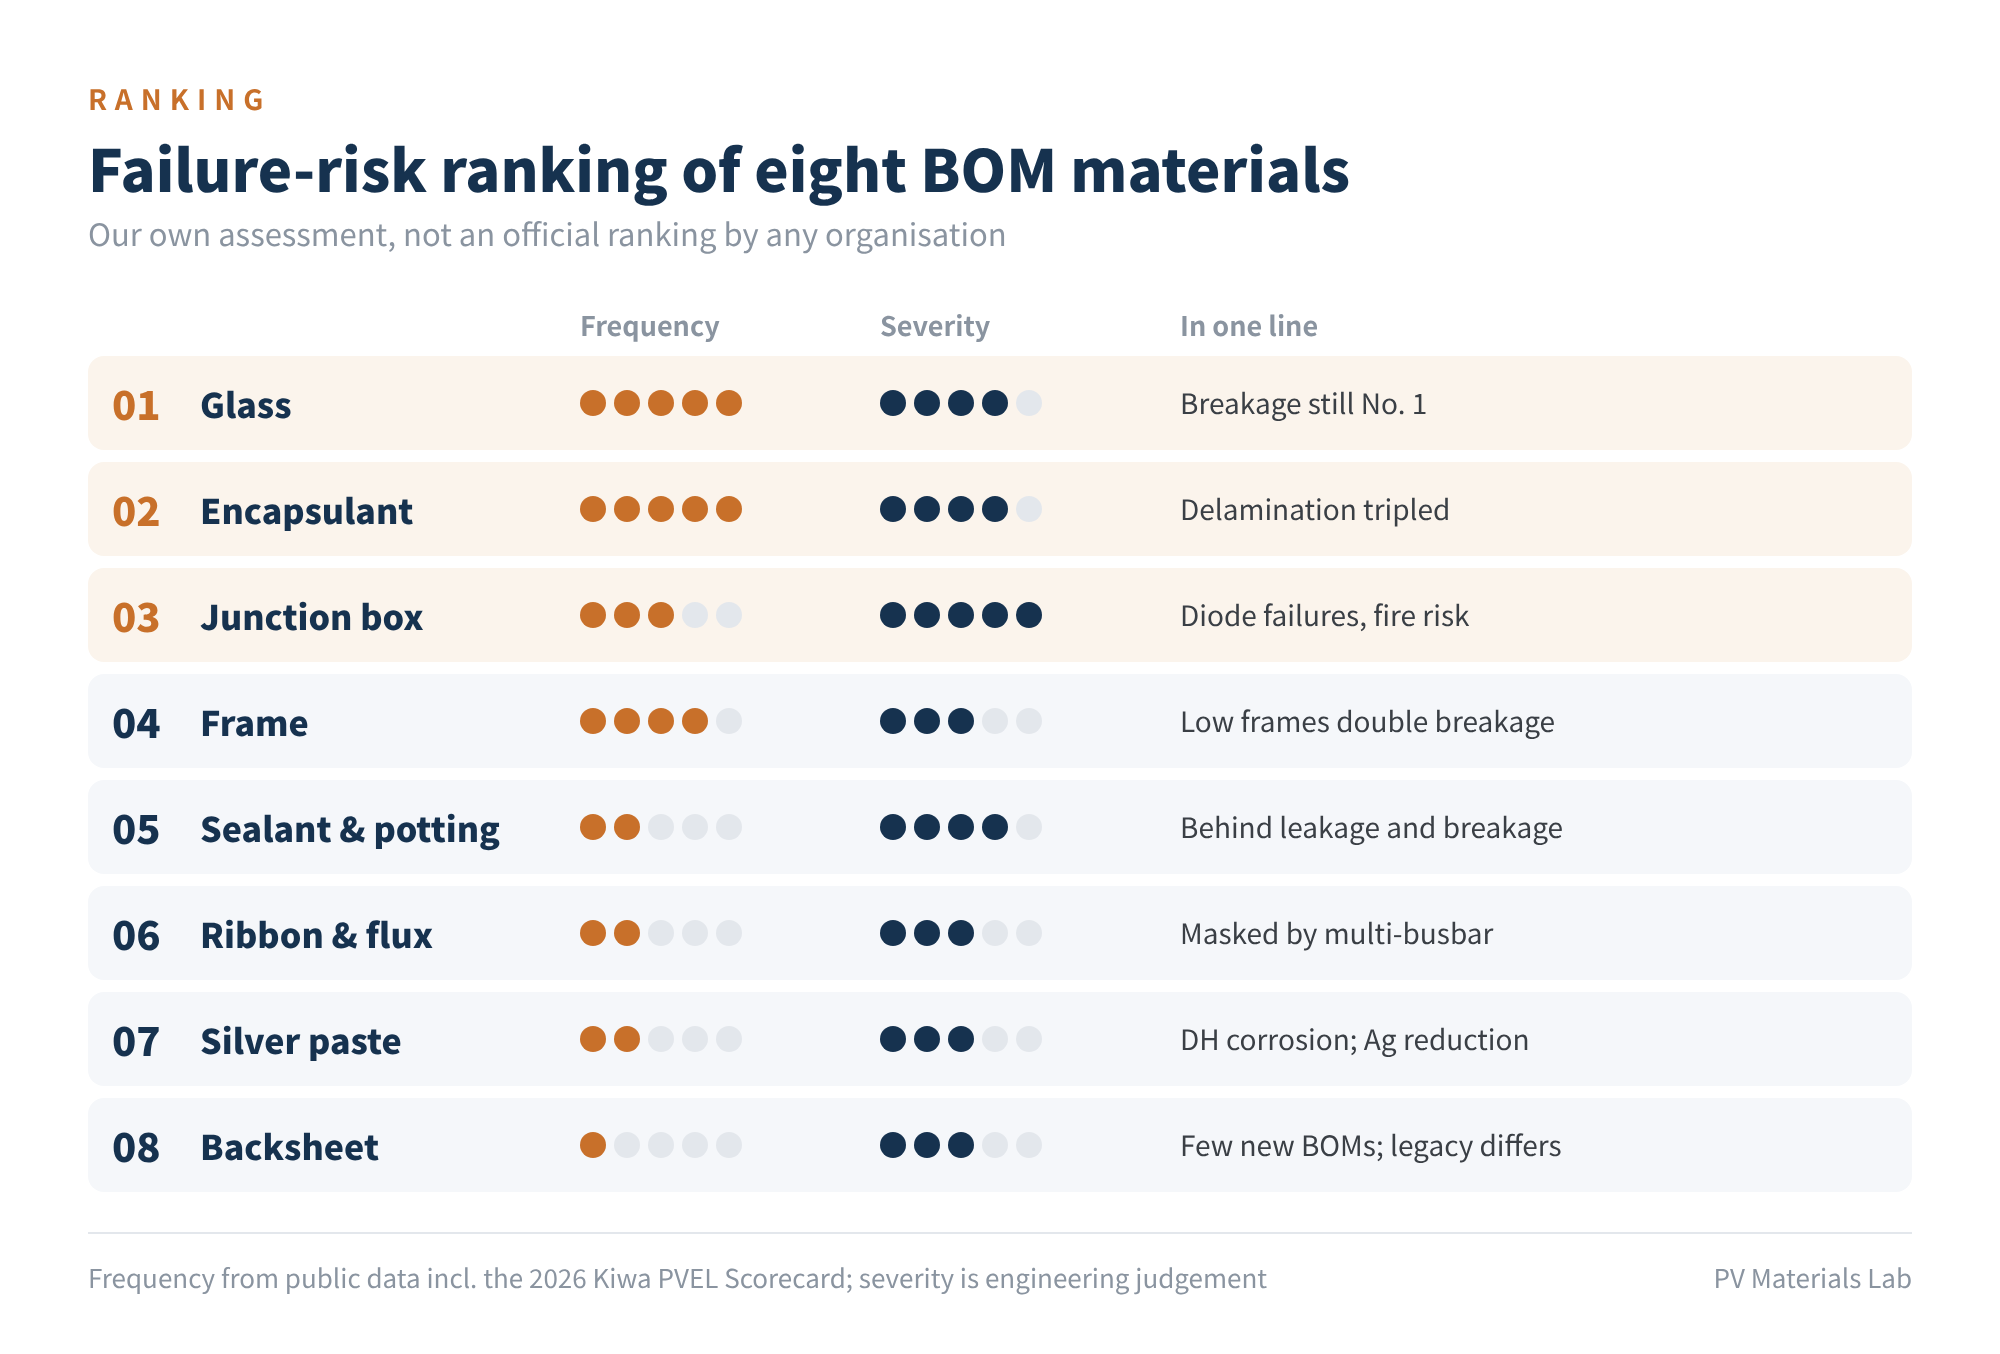
Figure 3 Failure-risk ranking of eight BOM materials (our assessment)
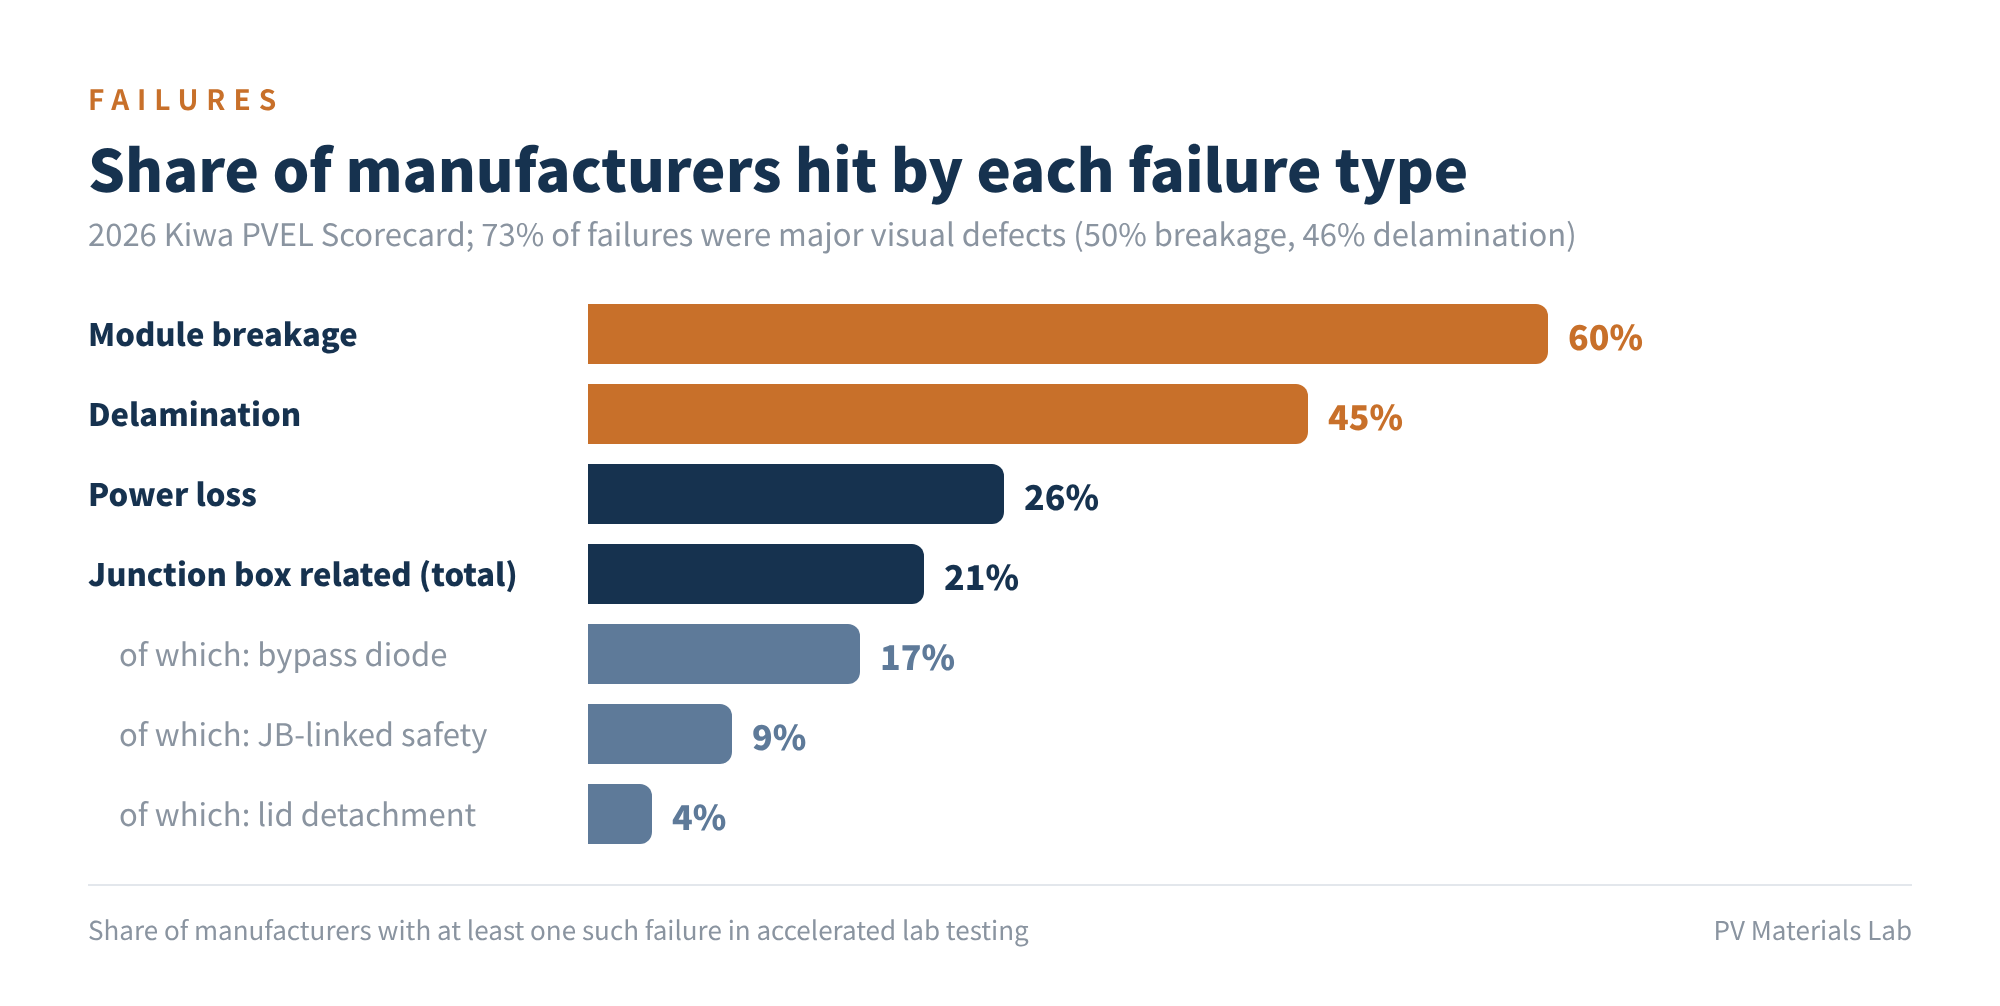
Figure 4 Share of manufacturers hit by each failure type, 2026 Scorecard
03Material by material
No. 1 Glass: breakage is still the top risk
- 60% of manufacturers had a module breakage failure
- 26% of BOMs in the mechanical stress sequence had at least one module break
- 2.0+2.0 mm glass-glass modules: 61% breakage under 45 mm hail
Kiwa PVEL's verdict is that module breakage remains the number-one reliability risk, and the data bear this out. In the hail sequence 23% of BOMs had breakage; standard 2.0+2.0 mm glass-glass modules saw 43% breakage at 40 mm hail, while thicker-glass designs saw only 7% at 45 mm. The September follow-up adds an even more telling example: of 20 modules from one BOM, 6 showed glass breakage after just a few weeks outdoors.
Breakage follows a clear pattern, concentrating at glass edges and near the junction-box hole. An IEA PVPS Task 13 report also flags that thin glass of ≤2 mm in new glass-glass designs "sometimes shows unpredictably high breakage rates".
Our view: Glass ranks first, but the glass makers should not take all the blame. 2.0 mm heat-strengthened glass in ever-larger formats has a thin strength margin to begin with; add holes, frames and mounting methods, and any weak link "cashes out" in the glass. Glass bears the consequences, but it is not necessarily the cause.
No. 2 Encapsulant: delamination rose fastest this year
- 45% of manufacturers had a delamination failure, triple the year before
- About one-third of major delamination appeared after damp heat
- Of BOMs losing more than 2% after TC600, over 70% used front encapsulants in the lowest quartile of area weight
Kiwa PVEL's lead called it an "epidemic". The typical appearance is a ring of bubbles around the module edge. Power barely drops, but once the bubbles join up they shorten the creepage distance; under IEC 61730 that is a major defect, a safety problem rather than a cosmetic one. In failed modules Kiwa PVEL measured, the required 0.3 mm creepage distance had shrunk to 0–0.2 mm.
The causes come down to a few points: too little encapsulant at the edges (lower area weight, edges squeezed thin), lamination recipes shortened to raise throughput, and glass-glass modules being harder to laminate than glass-backsheet ones. Glass-glass made up about nine-tenths of this year's samples. The September follow-up goes further and ranks the risk factors: encapsulant type (EPE on both front and rear triggered the most major delamination), edge pinch, lamination method and solder flux recipe are the four most important.
The other thread is chemical corrosion. A UNSW study in January found that one commercial POE caused TOPCon minimodules to lose about 55% of their power after DH1000, against about 11% for EVA samples from the same batch. Another study in February showed that magnesium-containing additives in white EVA worsen damp-heat degradation.
Our view: Rules of thumb that judge by material type, such as "POE is always safer than EVA", are no longer enough; you need to look at the specific formulation and additives. Encapsulant is the item to watch most closely this year.
No. 3 Junction box: fewer failures overall, more diode failures
- 21% of manufacturers had a junction-box-related failure
- Of these, bypass diode failures accounted for 17%
- One sample's diode melted after only TC200
The junction box is the only item on the list whose total failure rate fell (about one-third of manufacturers in the previous edition), and lid detachment dropped to 4%. But bypass diodes have become the bulk of junction box failures.
Kiwa PVEL's explanation: the margin between the junction box's current rating and the module's output current keeps shrinking. Module currents keep rising, but junction boxes have not been upgraded in step. The lab also reports a growing number of field reports of junction box hot spots and melting, some of which have started vegetation fires.
Connectors also deserve attention. kWh Analytics' 2026 report cites Nextpower data showing that 79% of high-risk connector and fuse issues have no detectable thermal signature at inspection, which means infrared drones cannot find them.
Our view: The junction box does not rank first on frequency, but its severity is the highest of the eight; when it fails, it burns. Placing it third is the result of weighing frequency against severity.
No. 4 Frame: the millimetres that were cut
- Frames <35 mm: breakage rate 17.9%
- Frames ≥35 mm: breakage rate 6.9%
- 62% of broken modules showed signs of pinched glass
This comparison comes from modules of 2.5–3.0 m². When the frame gets lower, the breakage rate rises to more than two and a half times the original.
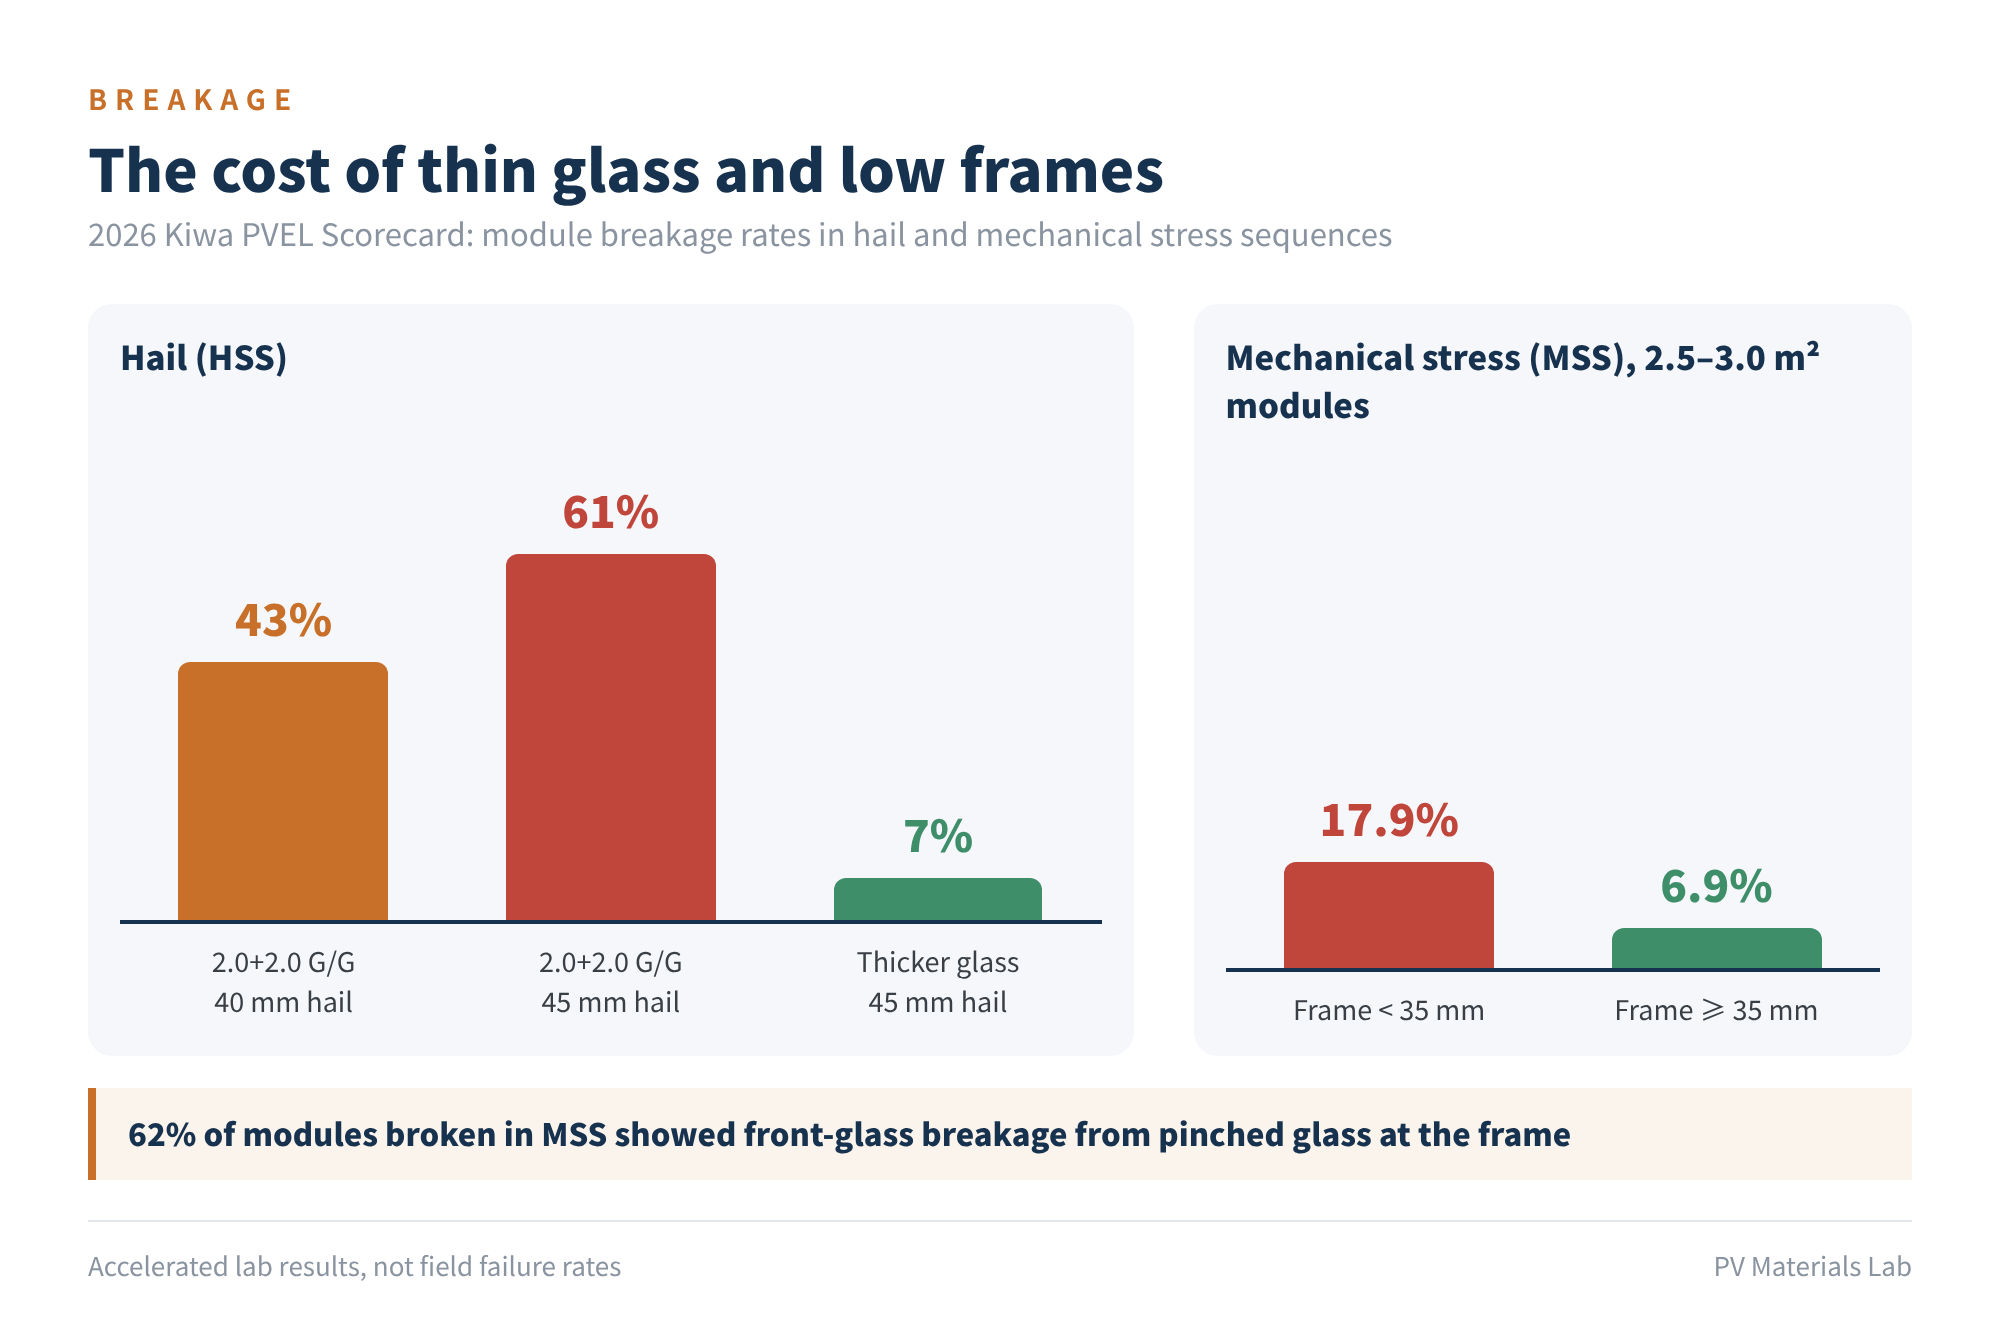
Figure 5 The cost of thin glass and low frames
Even more telling: of modules that broke under mechanical load, 62% showed front-glass breakage caused by the frame pinching the glass. More than 90% of samples already used the stronger 6005-T6 aluminium alloy, and that still did not stop breakage hitting a record. Kiwa PVEL's conclusion is that a stiffer frame is not necessarily better; a stiff frame can transfer stress to the glass through the pinch points.
Our view: The frame's problem is not the alloy grade but the cross-section design and how the frame works with the glass and silicone. Frame and glass are "co-defendants".
No. 5 Sealant and potting: problems from saving material
- 9% of manufacturers had a junction-box-linked safety failure (wet leakage)
- Cause: too little potting, exposing live parts in the box
- 4% of manufacturers had box lids fall off
Some samples failed wet leakage at initial inspection, without any ageing at all; opening them up showed the potting had not been filled properly.
Frame silicone is another hidden risk. Kiwa PVEL notes that some manufacturers changed their dispensing process to skip cleaning off excess silicone after framing, which raised the risk of direct glass-to-metal contact. That creates stress concentration points that eventually show up as breakage.
Our view: Adhesives and potting are among the cheapest of the eight materials, yet they pull on both the "leakage" and the "breakage" threads. They are rarely the subject of complaints themselves, but they are often the reason other parts are complained about.
No. 6 Ribbon and flux: "covered" by multi-busbar designs
- Thermal cycling is the sequence with the highest failure rate (over 35% of BOMs)
- 0BB modules: TC power loss ranging from 0.6% to 8.4%
- IEA PVPS lists poor soldering as a key failure type in new-generation modules
First, a caveat: thermal-cycling failures include delamination, diodes and other types, and public data do not separate out soldering-related failures, so this item lacks numbers that can be directly attributed.
Multi-busbar designs provide many redundant current paths, so a few poor solder joints no longer cut power directly as they did in the 3BB and 5BB era. That makes soldering problems "invisible" in power data. But results for zero-busbar (0BB) modules are already diverging, with the best under 1% and the worst over 8% after TC. UNSW's series of studies shows that flux residues act together with acetic acid from encapsulant hydrolysis to corrode the cell's front metallisation, and Kiwa PVEL also lists the flux recipe as a key cause of delamination: the wrong recipe can make the encapsulant lift away from the ribbons.
Our view: The ribbon itself is not the issue. The risk lies in the soldering window as ribbons get thinner, and in the chemical compatibility between flux, encapsulant and silver paste.
No. 7 Silver paste: the problem is damp heat; the variable is silver reduction
- TOPCon front silver-aluminium pastes are sensitive to damp-heat corrosion
- Glass frit composition has been confirmed as the key to corrosion resistance
- Low-silver and silver-free pastes are being adopted quickly, without long-term field data yet
A study published in May by UNSW and Jolywood found that corrosion of low-aluminium silver pastes is governed mainly by glass frit chemistry, and that barium-zinc-modified frits markedly improve resistance to acetic acid and damp heat. In other words, this problem has a solution, and most leading manufacturers are already applying it.
Our view: Silver paste did not stand out in this year's failure data. The real variable lies ahead: according to trade media estimates, silver paste is now the single largest cost item in a module, and low-silver and silver-free solutions are being adopted quickly, yet they currently lack long-term field data. This is the item we most want to keep tracking.
No. 8 Backsheet: last among new products, not necessarily in the installed base
- Backsheet modules made up only about 9% of tested samples
- A few years ago the share was close to 50%
The backsheet ranks last mainly because it "gets on the field" less often, not because it has become more reliable. With glass-glass now dominant, backsheets have little exposure in test data for new products.
Our view: If we counted complaints from plants already in operation, cracking of some early backsheet types would be hard to ignore, and the backsheet would rank much higher. It is a reminder to ask of any ranking: does it count new products or the installed base?
04Three takeaways
- None of the top five problems involves "new materials"; they come from old materials being thinned, reduced and run faster. Thin glass, low frames, low-weight encapsulants, short lamination times and junction boxes with small margins are each within specification on their own, but stacked together they use up the safety margin. As Kiwa PVEL puts it, there is not one red line between cost optimisation and reliability risk, but many.
- Passing certification does not mean reliable. One sample's diode melted after TC200, the duration IEC 61215 requires. IEA PVPS also points out that the current IEC 61215 series focuses on electrical performance and does not adequately cover the stability of the encapsulating polymers themselves.
- BOM failures can rarely be blamed on a single material. Delamination results from encapsulant formulation, lamination process, flux and glass surface acting together; breakage results from glass, frame, silicone and mounting acting together. Complaint analysis that looks only at the last material to fail will usually miss the root cause.
05Advice for the industry
- Buyers and plant owners: Write glass thickness, frame cross-section dimensions, encapsulant area weight and junction box current margin into technical agreements as specific numbers, rather than simply "complies with IEC".
- Module makers: When changing the BOM, assess "combination effects" first. Stacked changes such as thin glass with low frames, or low-weight encapsulant with fast lamination, need separate validation.
- Material suppliers: Proactively share formulation-level data (additive system, acid value, crosslinking window) with customers; it costs far less than explaining things afterwards in an 8D report.
- Everyone: Low power degradation does not mean a reliable module. In acceptance, give visual appearance, insulation, diode function and power equal weight.
06Final thoughts
What held reliability back in 2026 was not any new material, but margins "saved" away bit by bit, with glass, encapsulant and the junction box hit first.
From this year the Scorecard is published twice a year, with an updated edition due in November 2026; we will update this ranking then. Which BOM material generates the most complaints in your part of the chain? We would be glad to hear from you.
References
- Kiwa PVEL: 2026 PV Module Reliability Scorecard (home, Failures, Mechanical Stress Sequence pages); press release "Kiwa PVEL Debuts 12th Edition of the PV Module Reliability Scorecard", 27 May 2026
- Kiwa PVEL: PVSC 2026 Scorecard Failures poster; EU PVSEC 2026 Scorecard Failures presentation (September 2026)
- Solar Builder: "Why are PQP test failures increasing? A look at PV module reliability" (Tristan Erion-Lorico, 9 Sep 2026)
- TaiyangNews: "PVEL Scorecard 2026: Reliability Improves, Yet Failure Rates Rise" (June 2026)
- PV Tech: interview with Kiwa PVEL's Tristan Erion-Lorico (29 May 2026); "Buyer beware: Examining failures in the 2024 PV Module Reliability Scorecard"
- Kiwa: "Top Performers, Hidden Risks: Inside Kiwa PVEL's 2025 PV Module Reliability Scorecard"
- pv magazine USA: "Solar risks: Internal fire, regulatory fines, and battery inaccuracies" (kWh Analytics 2026 Solar Risk Assessment, 13 May 2026)
- IEA PVPS Task 13: Degradation and Failure Modes in New Photovoltaic Cell and Module Technologies (T13-30:2025)
- pv magazine: "Not all POE encapsulants protect TOPCon solar cells from corrosion" (16 Jan 2026); UNSW study of a new damp-heat failure mechanism (2 Feb 2026)
- pv magazine Australia: "Glass frit chemistry explains EVA-driven degradation mechanisms in TOPCon solar cells" (19 May 2026)
- OFweek Solar: "From silicon is king to silver reduction is king" (January 2026, in Chinese)
A PV R&D and technology team with 10+ years of experience | In-depth technical knowledge sharing
Materials · Reliability · Failure Analysis · Standards & Certification · Products · Processes
Exploring AI + PV; collaboration welcome
Disclaimer:
1. Original content reflects the authors' personal views only, is for reference only and does not constitute investment advice.
2. Reposted and cited content is credited to its source, out of respect for original work.
3. Some content was produced with AI assistance (chart generation, data retrieval, concept explanations, etc.); the core framework and key content were written by our technical team and reviewed by people.
4. If anything is inaccurate or infringes your rights, please leave a message or contact us and we will deal with it.