
One Circuit to Understand a Solar Cell: The Single-Diode Model
After reading this, you'll be able to answer
① Why a cell can be drawn as "current source + diode + two resistors"; ② which physical process in the cell Rs, Rsh, I0 and n each represent; ③ which parameter to suspect first when an I-V curve looks deformed.
Pick up an I-V test report for a cell or module and, besides Voc, Isc, FF and efficiency, you will often find two less prominent numbers: Rs and Rsh. Where do they come from? Why does FF drop when Rs is high, and why does low-light yield suffer when Rsh is low?
The answer lies in a circuit with just four components, called the single-diode equivalent circuit model (sometimes the single-diode equivalent resistance model, or the "five-parameter model"). I-V parameter extraction and the module models in yield simulation software such as PVsyst are all built on it. We explain it in eight figures.
01Why a cell can be drawn as a circuit
A crystalline silicon cell is essentially a very large-area PN junction. In the dark it is just an ordinary diode: it conducts forward and blocks in reverse.
Under illumination, photons create electrons and holes in the silicon, which are separated by the junction's built-in field to form a light-generated current. Its size is set essentially by the light alone and has little to do with the voltage across the cell, so it can be represented by a constant current source.
That gives the simplest picture: a constant current source in parallel with a diode. Add the two kinds of real-world losses, one "leaking away along the way" and one "blocking the road", and you have the complete equivalent circuit.
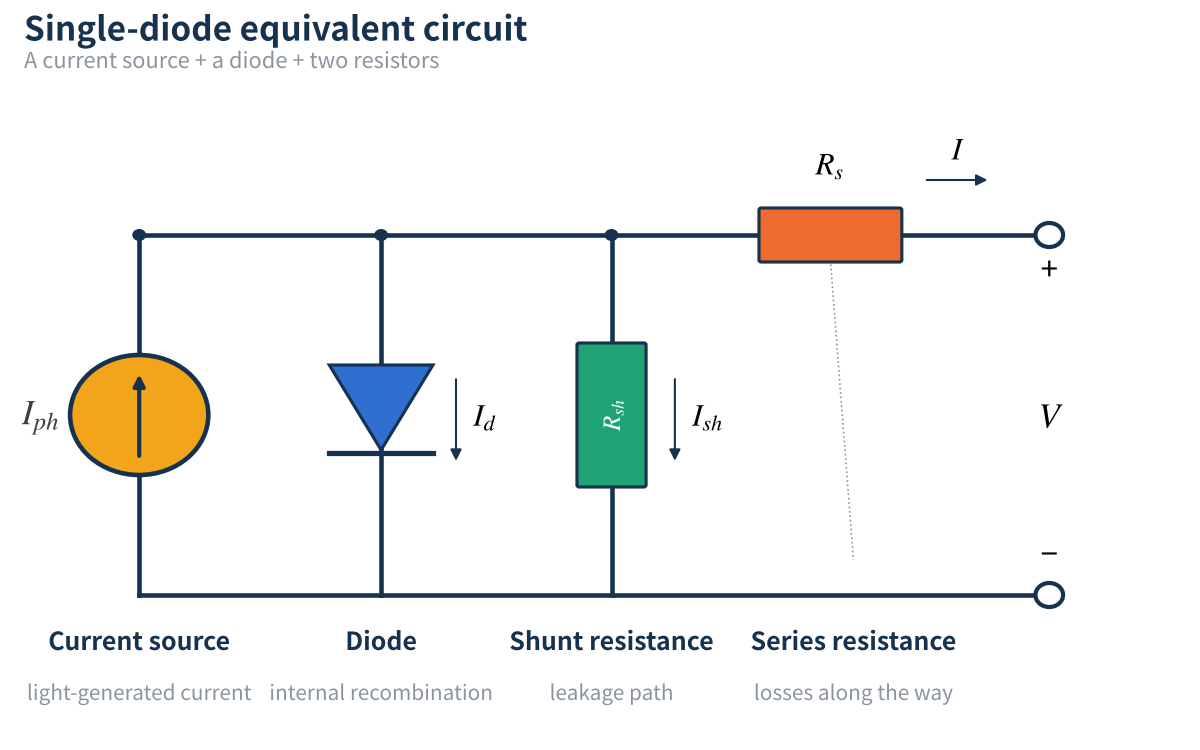
Figure 1 Single-diode equivalent circuit: four components, each for one physical process
02Four components, one job each
- Current source Iph (light-generated current): produced by light and proportional to irradiance; it also depends on how well the cell "absorbs" and "collects" light: anti-reflection, light trapping, finger shading, and surface and bulk passivation. Under standard test conditions, high-efficiency crystalline silicon cells reach about 40–42 mA/cm².
- Diode D (saturation current I0, ideality factor n): represents carrier recombination, i.e. photogenerated electrons and holes lost internally before they can flow out. The smaller I0, the less recombination and the higher the open-circuit voltage. n close to 1 means near-ideal behaviour; n tending towards 2 means significant recombination in the junction region or at defects.
- Shunt resistance Rsh (leakage path; higher is better): leakage paths that bypass the PN junction. Common sources: poor edge isolation, paste firing through the junction, microcracks, impurities and crystal defects, and shunting caused by PID (potential-induced degradation).
- Series resistance Rs (losses along the way; lower is better): the sum of all resistances current meets on its way out of the cell: wafer bulk resistance, lateral resistance of the diffused layer, metal–silicon contact resistance, and the line resistance of fingers and busbars. At module level, add ribbons, bus bars and the junction box.
Think of the cell as a water supply system. The current source is a pump: the stronger the light, the more it pumps. The diode is a pressure-relief valve that opens wider as pressure (voltage) rises, letting water flow back. The shunt resistance is a small leak in the tank, always quietly dripping. The series resistance is a long, narrow outlet pipe: the higher the flow, the bigger the pressure loss.
03One equation, five parameters
Applying Kirchhoff's current law to the circuit, the output current equals the light-generated current minus the diode current, minus the leakage current:
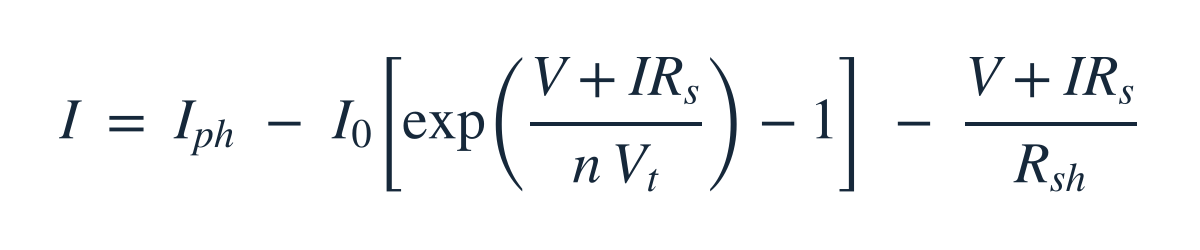
Here Vt = kT/q is the thermal voltage, about 25.7 mV at 25 °C. The equation has five parameters to determine: Iph, I0, n, Rs and Rsh, which is where the name "five-parameter model" comes from.
To remove the effect of cell size, everything below uses area-normalised quantities: current as current density J (mA/cm²) and resistance in Ω·cm². All curves are based on the illustrative parameter set below, close in magnitude to today's mainstream high-efficiency n-type cells but not representing any specific product.
| Parameter | Value | Meaning |
|---|---|---|
| Jph | 41.0 mA/cm² | Light-generated current density |
| J0 | 27.5 fA/cm² | Saturation current density |
| n | 1.0 | Ideality factor |
| Rs | 0.5 Ω·cm² | Series resistance |
| Rsh | 5000 Ω·cm² | Shunt resistance |
Table 1 Baseline parameters used in this article (STC: 1000 W/m², 25 °C)
04The I-V curve comes from a subtraction
Start with the simplest case: no series resistance and no leakage. The output current is then a horizontal line (the light-generated current) minus an exponential curve (the diode current).
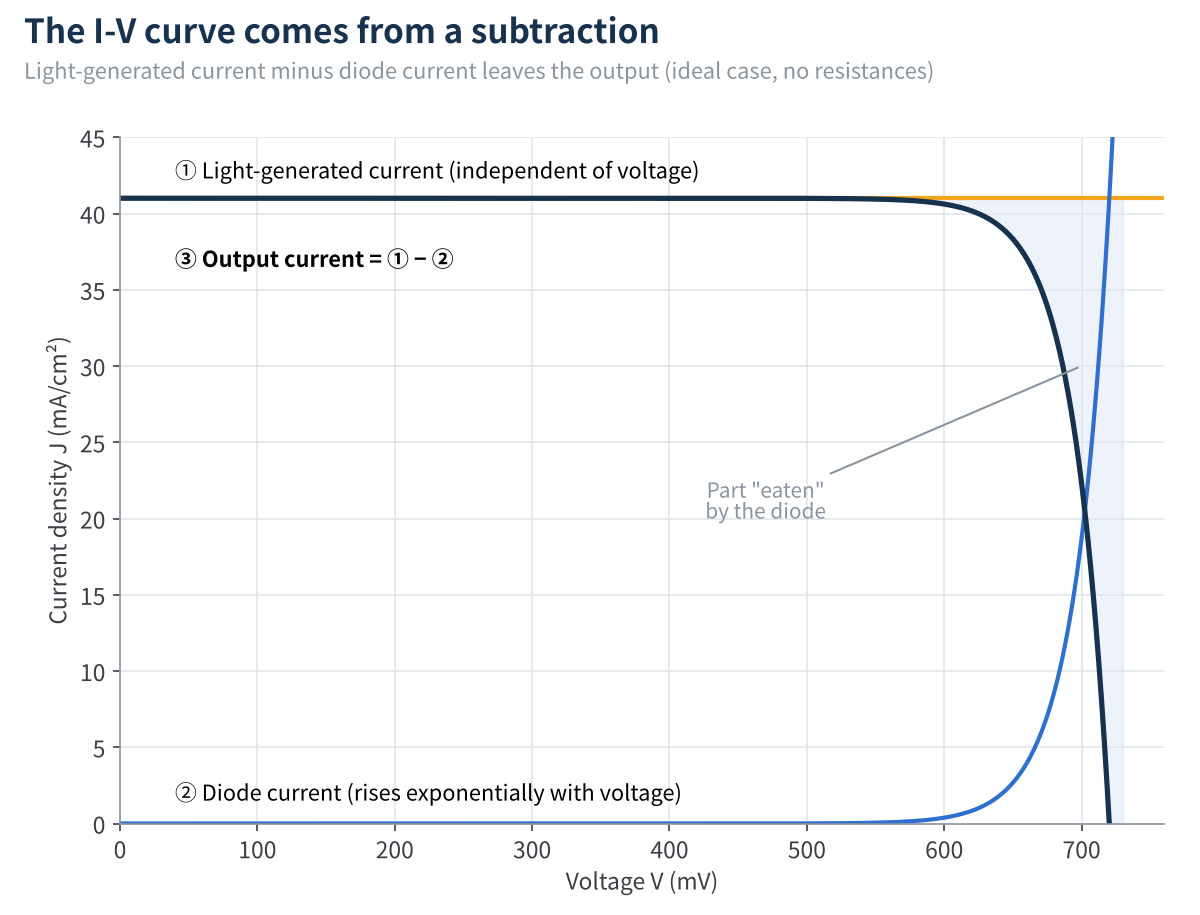
Figure 2 Where the I-V curve comes from: a flat light-generated current minus an exponentially rising diode current
- At short circuit (V = 0): the diode barely conducts and all the light-generated current flows to the external circuit, so the short-circuit current Isc ≈ Iph.
- As voltage rises: the diode current grows exponentially and "eats" more and more of the light-generated current. When it eats all of it, the output current reaches zero, and that voltage is the open-circuit voltage:

This expression deserves a second look. Iph and I0 are both inside the logarithm, so every tenfold increase in I0 lowers Voc by about 59 mV (n = 1, 25 °C). From PERC to TOPCon, HJT and BC, the main thread of cell technology in recent years has been passivation, which in essence is all about pushing I0 down.
05Three key points and the fill factor
Add series resistance and leakage back in, calculate with the Table 1 parameters, and you get a complete I-V curve. Three points on it matter most: the short-circuit point, the open-circuit point, and the point where voltage times current is highest, the maximum power point (MPP).
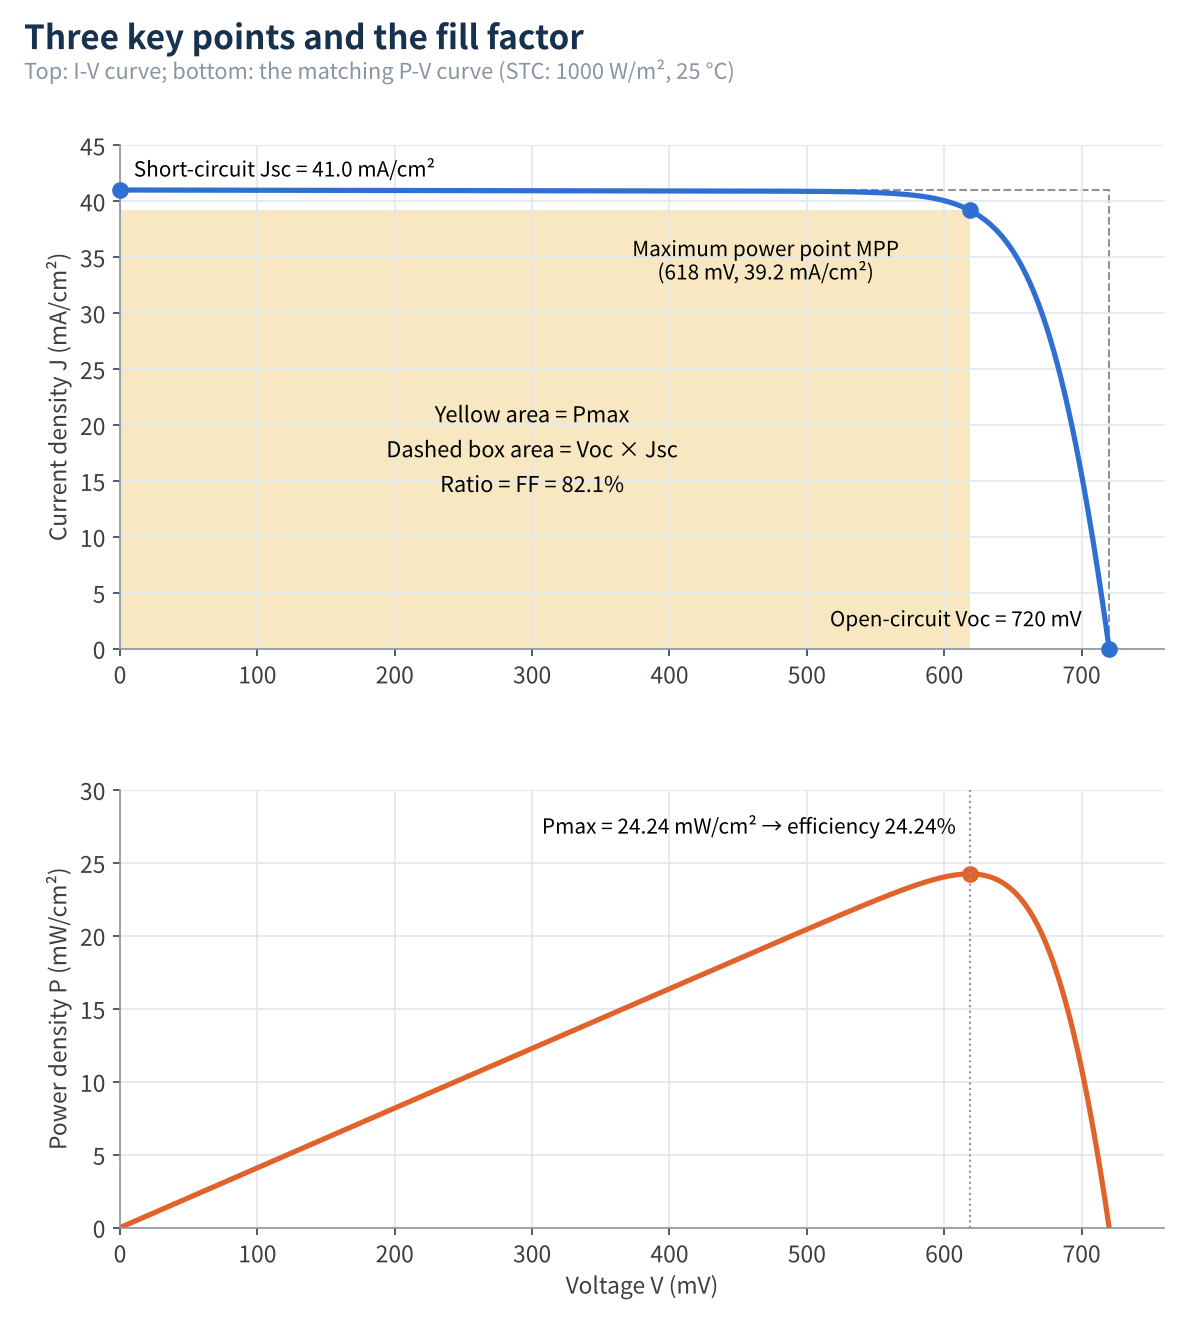
Figure 3 I-V and P-V curves with baseline parameters

The fill factor FF measures how "square" the curve is. In this example the calculation gives Voc = 720 mV, Jsc = 41.0 mA/cm², FF = 82.1% and an efficiency of 24.24%.
With Rs set to 0 and Rsh to infinity, the same diode could give an FF of up to about 85.0%. In other words, 2.9 percentage points of this cell's FF are eaten by the two resistances: about 2.6 points by Rs and about 0.3 by Rsh. Let's look at how each one does it.
06Series resistance Rs: collapsing the knee
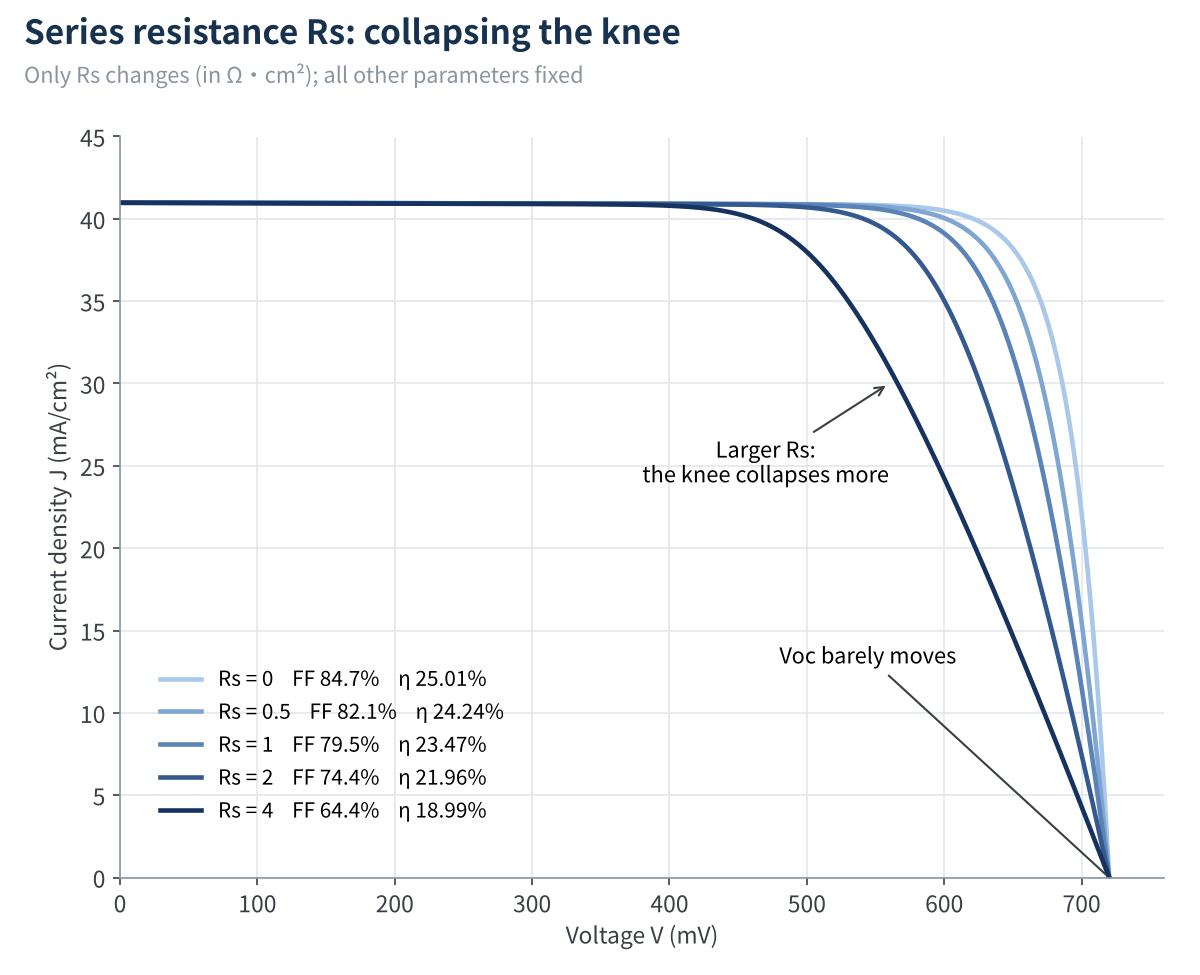
Figure 4 I-V curves when only Rs changes
- Voc is unchanged. At open circuit no current flows, so there is no voltage drop across Rs.
- Isc is essentially unchanged. Unless Rs is absurdly large, short-circuit current is barely affected.
- The knee collapses. Near the maximum power point the current is high, so the drop across Rs is large; the curve's "shoulder" is cut away and FF falls.
A handy estimate: the relative FF loss ≈ Rs × Jsc / Voc. For this example, 0.5 × 0.041 / 0.72 ≈ 2.8%. Put more intuitively, each 0.1 Ω·cm² increase in Rs costs about 0.5 percentage points of FF and about 0.15 points of efficiency.
The loss in Rs is I²R, proportional to the square of the current. Half-cut modules halve the current in each string, cutting ribbon losses to about a quarter; multi-busbar designs shorten the distance current must travel along the fingers. Both work on the same parameter.
07Shunt resistance Rsh: tilting the plateau
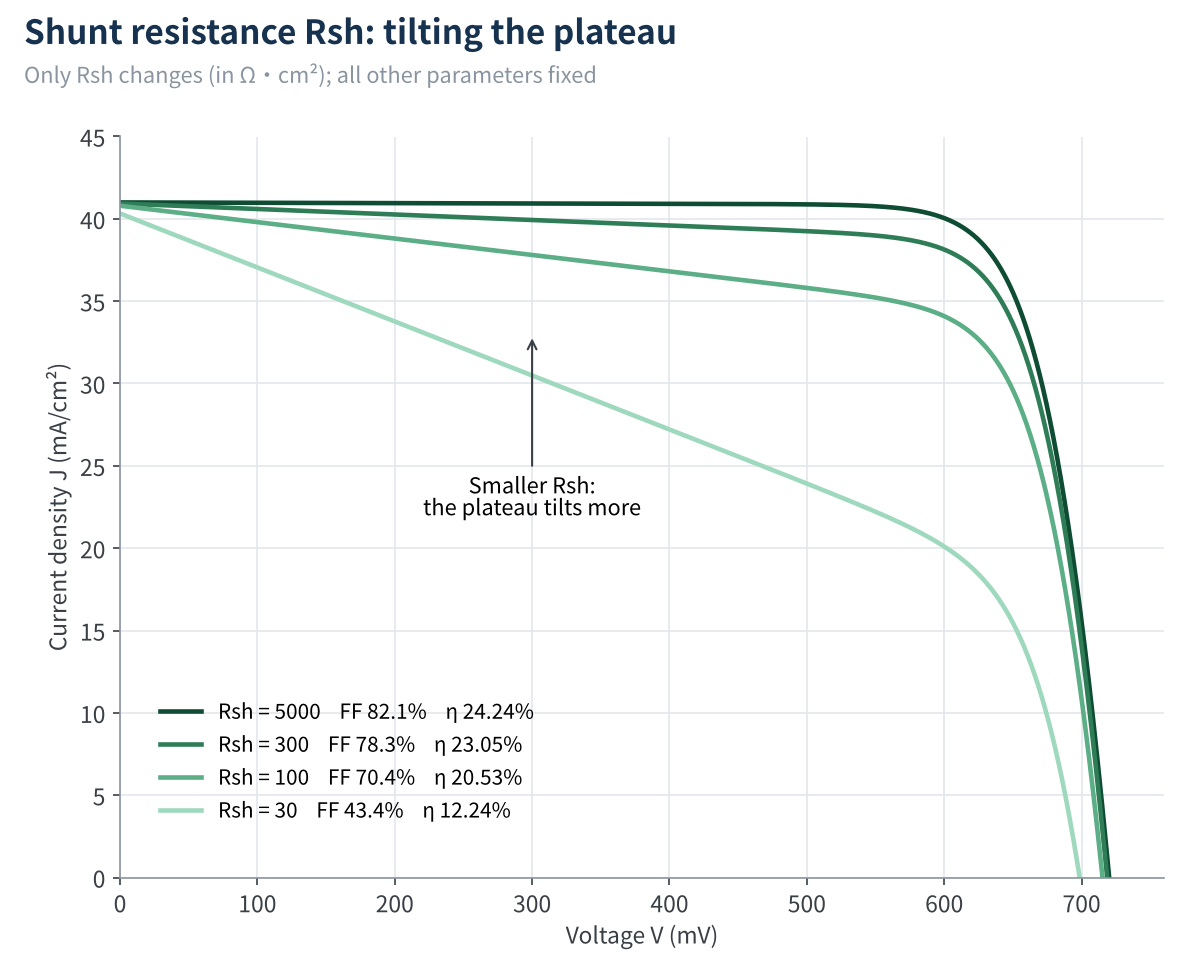
Figure 5 I-V curves when only Rsh changes
- The plateau tilts. Near Isc the curve's slope is about −1/Rsh; the smaller Rsh, the more this supposedly flat "plateau" tilts.
- FF falls. Once Rsh drops below a few hundred Ω·cm², the FF loss becomes noticeable.
- Voc gets dragged down too. With severe enough leakage (Rsh = 30 in the figure), even the open-circuit voltage suffers.
At standard irradiance, Rsh has little visible effect as long as it isn't too poor. Its real damage shows up in low light:
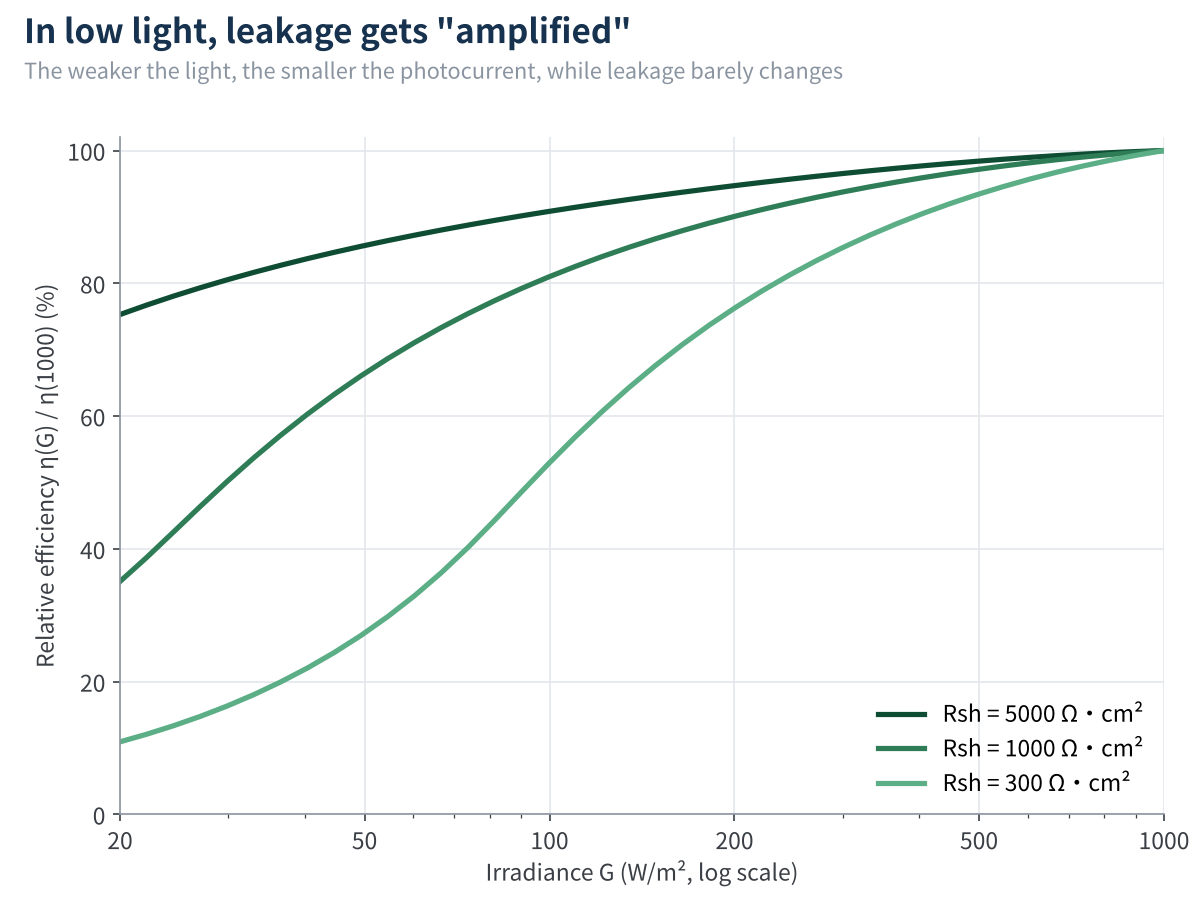
Figure 6 Efficiency versus irradiance for different Rsh (each normalised to 100% at 1000 W/m²)
The reason is simple: leakage current is roughly V / Rsh and almost independent of light intensity, whereas light-generated current is proportional to it. The weaker the light, the larger the share that leaks away. With this article's parameters, at 200 W/m² a cell with Rsh = 5000 still keeps 95% of its STC efficiency, Rsh = 1000 keeps 90%, and Rsh = 300 only 76%.
So when a cell or module performs poorly in low light, Rsh is the first suspect.
08Irradiance drives current, temperature drives voltage
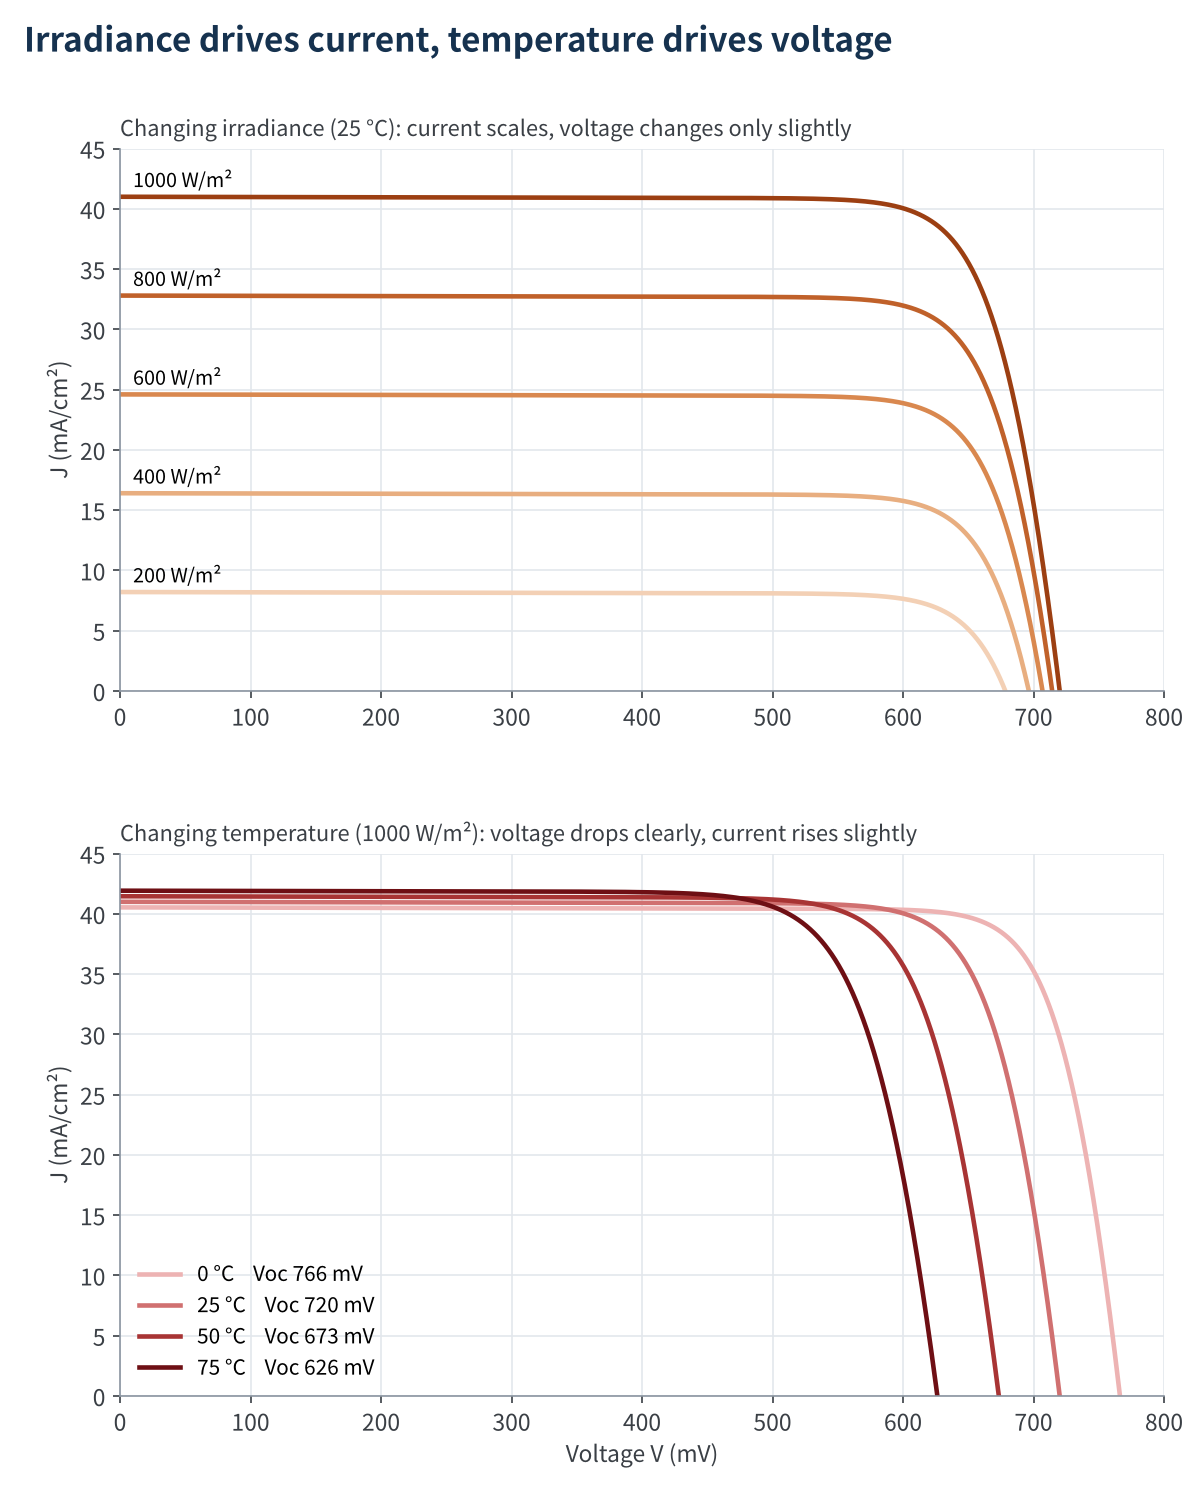
Figure 7 Effects of irradiance and temperature on the I-V curve
Irradiance directly sets Iph, so current scales in proportion to light intensity. Voltage changes only logarithmically: from 1000 down to 200 W/m², current falls to a fifth, while Voc only drops from 720 mV to 678 mV.
Temperature mainly affects the diode. As temperature rises, the intrinsic carrier concentration in silicon increases sharply, I0 rises exponentially and Voc falls. In this article's model, the temperature coefficient of Voc is about −1.9 mV/°C (−0.26%/°C), current rises slightly (+0.045%/°C), and together the temperature coefficient of maximum power is about −0.30%/°C, close to typical values on n-type module datasheets.
09Turn off the light: the dark I-V curve
Apply a forward voltage to the cell without illumination and you measure the dark I-V curve. Plot current on a log scale and the "territories" of the three parameters separate clearly.
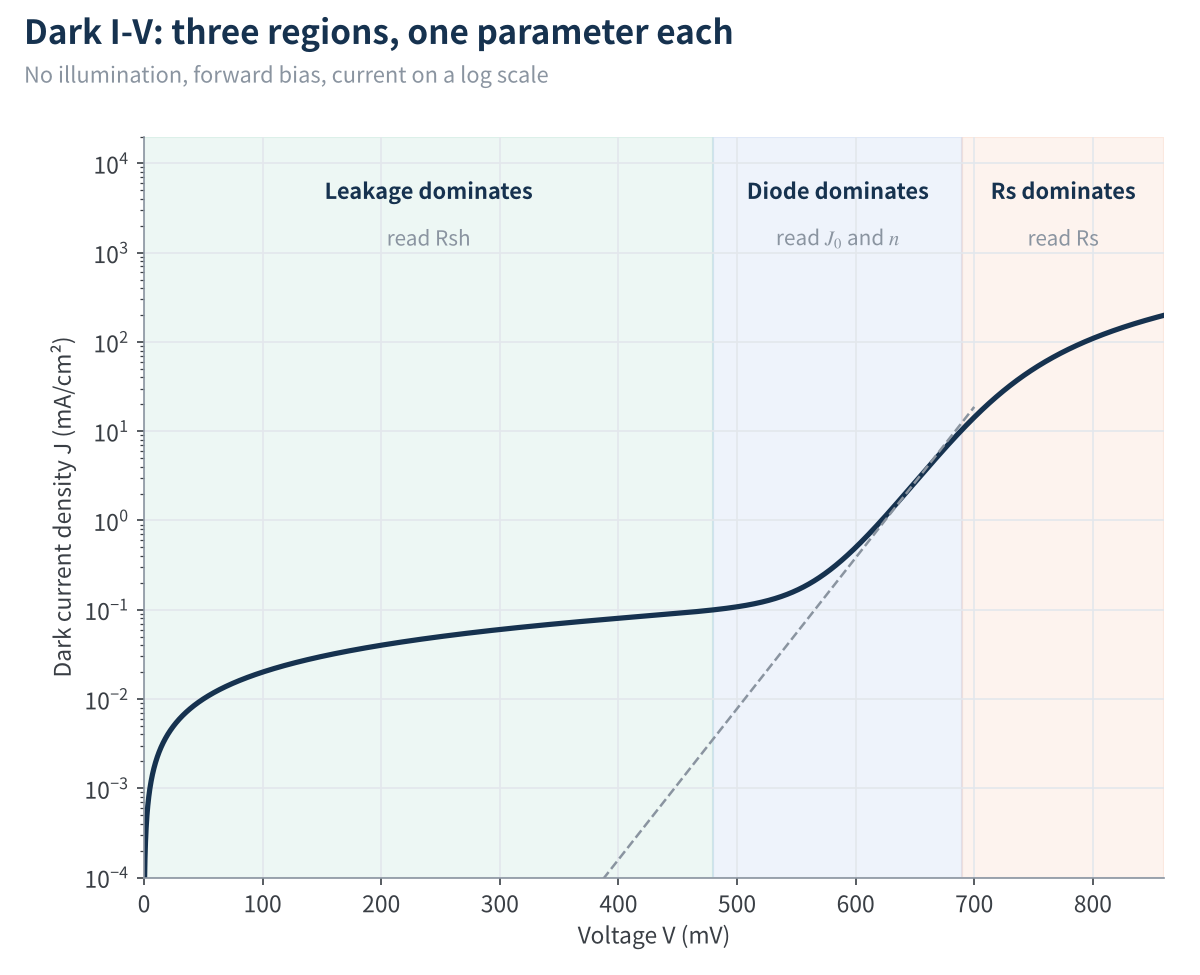
Figure 8 The three regions of a dark I-V curve
- Low-voltage region: the diode is not yet conducting, so current flows only through leakage paths; this region's level is set by Rsh.
- Middle region: diode current dominates and forms a straight line on the log scale; the slope reflects n and the intercept reflects I0.
- High-voltage region: current is large and the drop across the series resistance bends the curve down; the earlier it bends, the larger Rs.
That is why dark I-V is such a practical diagnostic in the lab and on the line: one sweep, with each of the three parameters read from its own region. IEC 60904-1:2020 also added an informative annex on dark I-V curves.
10What this model cannot handle
The single-diode model is simple and useful, but it is still an approximation. The following cases need more sophisticated tools:
- Detail at low voltage and low light. Adding a second parallel diode with n = 2 to describe depletion-region recombination gives the double-diode model, which fits these regions better.
- Rs is not a constant. Real series resistance is distributed and varies slightly with current and irradiance; the model treats it as a single lumped value.
- Reverse bias. A shaded cell is reverse-biased and may even break down and heat up. Analysing hot spots requires adding a reverse-breakdown term to the model.
- Modules and strings. For cells in series, multiply n·Vt by the number of cells and scale the resistances accordingly. But as soon as mismatch, shading or bypass diode activation appears, each cell must be modelled individually.
- Dynamic effects. High-efficiency n-type cells have large junction capacitance, so too short a test pulse distorts the curve; perovskite cells also show hysteresis. These are time-dependent processes that a steady-state model cannot describe. IEC 60904-1:2020 added an informative annex on PV devices with capacitance, worth checking when testing high-efficiency cells and modules.
11Quick reference: from curve shape to cause
| What the curve shows | Parameter | Common causes |
|---|---|---|
| Current low overall | Iph down | Insufficient irradiance, soiling or shading; reduced transmittance of glass or encapsulant (e.g. yellowing); anti-reflection coating problems |
| Voc low, whole curve shifted left | I0 up, or temperature high | Passivation degradation (LID, LeTID, UV-induced degradation, etc.); test temperature too high; shorted cells or a conducting bypass diode in a module drop Voc in steps |
| Knee collapsed, slope near Voc shallower | Rs up | Broken fingers or contact degradation; poor or cold solder joints; higher connection resistance at bus bars or junction box; metallisation corrosion |
| Plateau near Isc tilted | Rsh down | Edge leakage, microcracks, PID shunting; in modules, current mismatch between cells can cause a similar tilt, so check with EL |
| Steps in the curve | Beyond the single-diode model | Partial shading, broken cells or severe mismatch activating bypass diodes; analyse cell by cell rather than describing the whole module with one parameter set |
12Final thoughts
With only four components and five parameters, the single-diode model explains almost every "normal" change on an I-V curve. Once it is in your head, a test report is no longer just a few numbers: you can follow the curve's shape back to the specific part of the cell where something went wrong.
① A cell = current source (light-generated current) + diode (recombination) + shunt resistance (leakage) + series resistance (losses along the way).
② Iph sets the current, I0 and n set the voltage, and Rs and Rsh set how "square" the curve is.
③ Rs collapses the knee without moving Voc; Rsh tilts the plateau and is especially damaging in low light.
What puzzling I-V curves have you come across? We would be glad to hear from you.
References
- IEC 60891:2021, Photovoltaic devices – Procedures for temperature and irradiance corrections to measured I-V characteristics (3rd edition, adds an annex on supplementary methods for series resistance determination)
- IEC 60904-1:2020, Photovoltaic devices – Part 1: Measurement of photovoltaic current-voltage characteristics (3rd edition, adds informative annexes on devices with capacitance and dark I-V curves)
A PV R&D and technology team with 10+ years of experience | In-depth technical knowledge sharing
Materials · Reliability · Failure Analysis · Standards & Certification · Products · Processes
Exploring AI + PV; collaboration welcome
Disclaimer:
1. Original content reflects the authors' personal views only, is for reference only and does not constitute investment advice.
2. Reposted and cited content is credited to its source, out of respect for original work.
3. Some content was produced with AI assistance (chart generation, data retrieval, concept explanations, etc.); the core framework and key content were written by our technical team and reviewed by people.
4. If anything is inaccurate or infringes your rights, please leave a message or contact us and we will deal with it.